How a single GEO T20 device gave a mountain road authority 11 days of warning before a slope failure nobody expected.
The road authority didn’t think the slope was particularly dangerous. It had been stable for years — no visible cracks, no reported movement, nothing that flagged in the annual inspection. The GEO T20 disagreed. Quietly, without any drama, it started logging a 4 millimetre displacement in the upper section of the slope. Then 6mm. Then the alerts started. Eleven days later, the slope failed.
The alert thresholds were set in consultation with the road authority’s geotechnical team. Three millimetres would trigger a notification email. Eight millimetres would trigger an amber warning requiring a site inspection within 24 hours. Fifteen millimetres would trigger the red alert — the pre-agreed protocol called for immediate road closure and emergency assessment. These numbers were conservative by design. Better to inspect something that turns out fine than miss something that doesn’t.
3. What the Monitoring System Detected — Day by Day
For the first six weeks after installation, nothing of note happened. Images came in on schedule, the slope looked as expected, and the platform logged a baseline that would later prove invaluable. Then, in the third week of October, something changed.
4. The Response: What Happened When the Alerts Fired
Something that gets underappreciated in monitoring case studies is how much the quality of the alert matters — not just whether one fires. A vague alert saying “something might be happening” is not the same as an alert that says “4mm displacement detected in sector B3, see attached comparison images from 72 hours ago.”
Every alert the Avacam platform sent included a link directly to the image comparison view — the engineer receiving the notification could immediately see a side-by-side of the current image and the baseline, with the displacement zone highlighted. No login confusion, no searching through folders, no waiting. The data was there, readable, and actionable within seconds of opening the email.
“When the amber alert came through, I had the comparison images open on my phone within about 30 seconds. I could see exactly where the movement was before I even made a phone call.”
— Geotechnical Consultant, on-site response team
That speed mattered. The decision to escalate, to bring in the geotechnical consultant, to find the crack at the crest — all of that happened faster because the data was immediately legible. In an emergency, every hour of decision-making delay is a real cost.4
5. The Slope Fails — and Nobody Is on the Road
The failure itself happened in the early hours of October 31st. The GEO T20 was still running. It captured the failure sequence across four consecutive image frames — the progressive detachment of the upper block, the debris run, and the final deposition pattern on the road below. These images were automatically stored in the permanent cloud archive.
Based on the failure timing — 02:14 on a midweek morning — traffic modelling suggests approximately 12–18 vehicles would have been on that section of road during the 30-minute window around the failure event under normal operating conditions. The road was closed 48 hours before the failure occurred. No traffic. No casualties. No near misses.
The debris volume — around 850 cubic metres — was substantial enough to have caused fatal accidents had any vehicle been caught underneath it. The cleanup and road reinstatement took 19 days and cost approximately €380,000. The monitoring system, including hardware, installation, and 12 months of platform subscription, cost a fraction of that.
6. After the Event: The Data That Told the Full Story
One of the things that surprised the road authority most was how useful the monitoring data was after the event — not just before it. The complete image archive, going back to the installation date six weeks earlier, gave the investigation team a precise record of when movement started, how fast it progressed, and what the failure mechanism looked like in sequence.
This data did three important things:
- It supported the insurance claim — the road authority had documented evidence of the entire event, from first detection to failure, with timestamps on every image. The claim was settled without dispute.
- It informed the remediation design — the engineers designing the rock anchoring and drainage solution could see exactly where the failure initiated and how it propagated. That’s far more useful than a post-failure inspection of a debris pile.
- It changed the authority’s monitoring programme — within three months of the event, the authority commissioned Avacam systems on four additional slopes in the same corridor. The budget came from the insurance payout.
Outcome summary = zero casualties. Road closed 48 hours before failure. Full failure sequence documented. Insurance claim settled in full. Four additional monitoring sites commissioned within 90 days of the event.
7. What This Case Teaches Us
We’ve written this up not to pat ourselves on the back, but because the lessons here apply to a lot of sites that are currently unmonitored. A few things stand out clearly.
Visual inspection alone is not enough
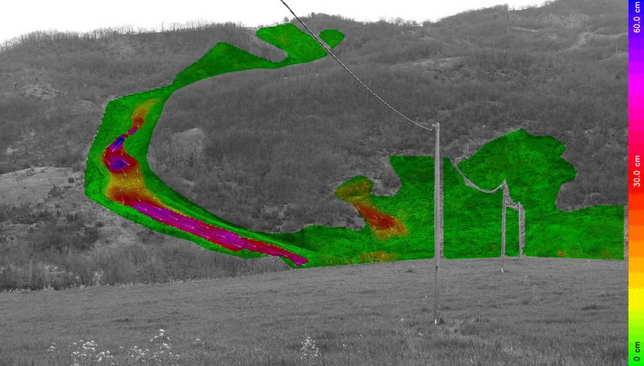
The annual inspection had passed this slope as low risk just three years earlier. That assessment wasn’t wrong at the time — but conditions change, groundwater levels change, and the slope was already moving before anyone could see it from the road. The 4mm displacement that triggered the first notification was completely invisible to the naked eye at 110 metres distance. Only a 20-megapixel camera with baseline comparison could catch it.
Early warning only works if thresholds are set correctly
The 3mm notification threshold was conservative. Some engineers pushed back on it during setup — “you’ll get too many false alerts.” In this case, that 3mm alert was the thing that put the slope on the authority’s radar six days before the red alert fired. If the lowest threshold had been set at 10mm, the first notification would have come 48 hours before closure — not six days. The margin for decision-making would have been much smaller.
The response protocol matters as much as the detection
The road authority had agreed on the response protocol before anything happened. When the amber alert came, everyone knew what to do. No committee meeting, no escalation debate, no “let’s wait and see.” The protocol said: amber alert means geotechnical inspection within 24 hours. That happened. That decision directly led to finding the tension crack — the piece of evidence that justified the eventual road closure.
Post-event data has serious financial value
The monitoring archive was worth real money in the insurance claim. An undocumented slope failure leaves the road authority trying to reconstruct a timeline from memory and post-event inspection. A fully documented one — with timestamped images showing every stage of the progression — is a completely different conversation with an insurer.
8. Key Takeaways
Monitoring doesn’t prevent slope failures. Nothing does — geology does what geology does. What monitoring gives you is time. Time to inspect, time to decide, time to close a road before 850 cubic metres of rock and clay lands on it. In this case, 11 days was more than enough. On a different site, with a faster-moving failure mechanism, even 48 hours might be the difference between a closed road and a disaster. The cost of a GEO T20, installed and running for 12 months, is a rounding error compared to what was avoided here. That’s the argument, and we think it’s a straightforward one.
Have a Slope That Needs Watching?
Tell us about your site. We’ll recommend the right device, help define your alert thresholds, and have it transmitting data within days of installation.